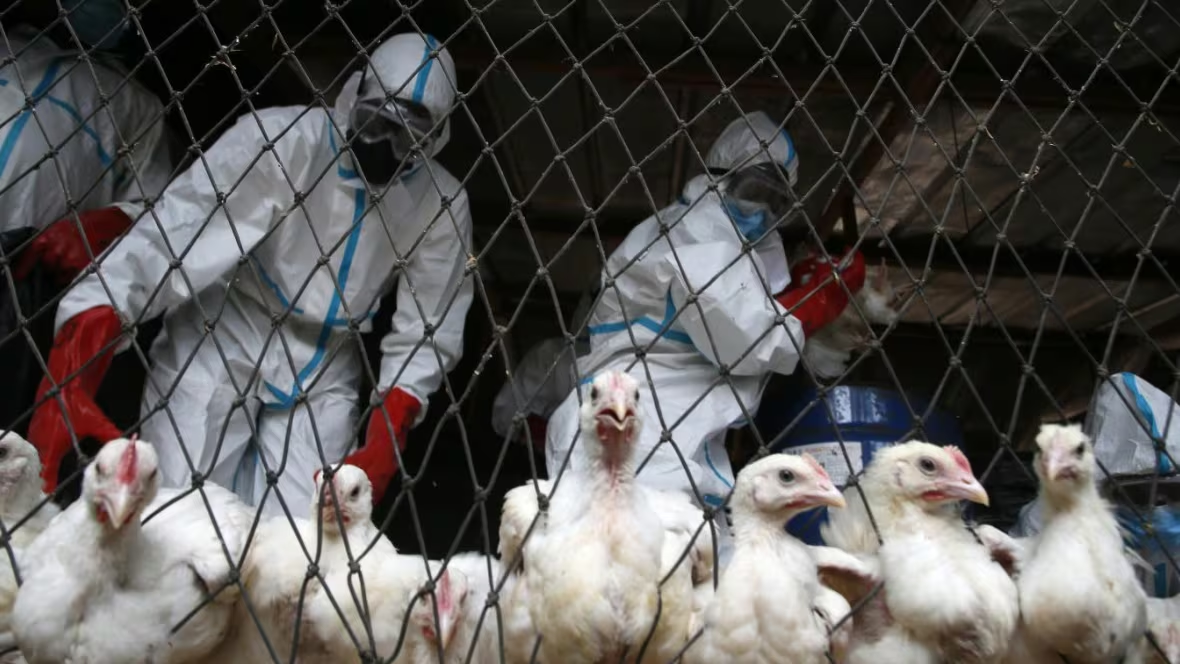
Detailed Report on the Number of Diseases with Surveillance Activities by Country in 2024

د. ماجد حمید الصایغ / اختصاص امراض الدواجن / استرالیا
Overview
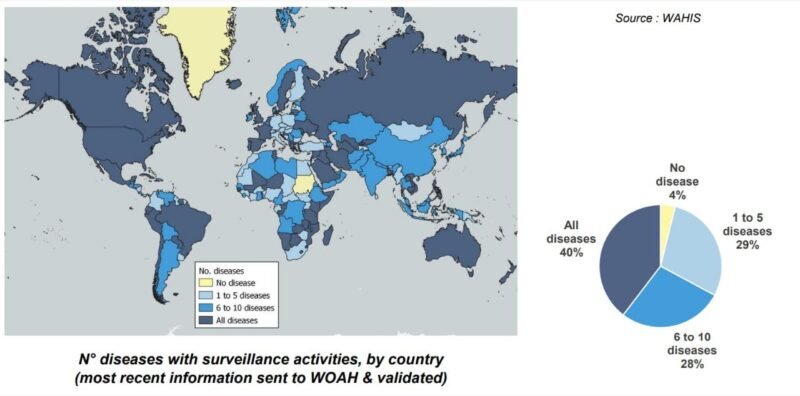
This report presents a global map and pie chart illustrating the number of diseases monitored by countries, based on data submitted to and validated by the World Animal Health Information System (WAHIS). Disease surveillance is a critical component in identifying, monitoring, and controlling animal health threats. The data categorise countries into different levels of disease surveillance, highlighting global and regional trends.
Key Insights from the Map
- Countries with No Disease Surveillance (4%)
Represented in pale yellow, these countries report no active surveillance for animal diseases. They are primarily found in regions facing systemic challenges such as:
Limited infrastructure for disease reporting.
Weak veterinary public health systems.
Political instability affecting surveillance programs.
- Countries with Surveillance for 1 to 5 Diseases (29%)
Shown in light blue, these countries conduct minimal disease surveillance. They are mainly located in:
Parts of Africa.
Small nations in the Pacific and the Caribbean. These countries may lack financial and technical resources, limiting their capacity to expand surveillance.
- Countries with Surveillance for 6 to 10 Diseases (28%)
Represented in medium blue, these countries demonstrate moderate surveillance capacity. They include:
Central Asia.
Parts of South America.
Eastern Europe. This category likely reflects countries in transition, building their capacity to address region-specific diseases.
- Countries with Surveillance for All Diseases (40%)
Depicted in dark blue, these countries conduct comprehensive surveillance for all diseases listed under WAHIS. They include:
North America (USA, Canada).
Most of Western and Northern Europe.
Australia and New Zealand. These countries typically have advanced veterinary health systems, sophisticated laboratories, and strong policy frameworks for disease surveillance and response.
Analysis of the Pie Chart
The pie chart summarises the proportion of countries in each surveillance category:
- All diseases (40%): The largest segment, indicating that a significant number of countries maintain comprehensive surveillance.
- to 5 diseases (29%) and 6 to 10 diseases (28%): Together, these categories represent 57% of countries, highlighting varying levels of limited surveillance.
- No disease (4%): The smallest segment, indicating a minimal number of countries without any surveillance programs.
Regional Highlights
Africa
Many countries fall into the light blue (1 to 5 diseases) or medium blue (6 to 10 diseases) categories, indicating limited to moderate surveillance.
A few countries, such as Central African Republic and South Sudan, are in the yellow category, showing no surveillance.
Asia
Countries like India, China, and Japan are in the dark blue category, reflecting robust surveillance systems.
Central Asian countries, such as Kazakhstan and Uzbekistan, are in the medium blue range, showing moderate surveillance efforts.
Europe
Most Western and Northern European countries are in the dark blue category, highlighting comprehensive surveillance systems.
Some Eastern European countries demonstrate moderate efforts, falling within the medium blue category.
North and South America
North America (USA, Canada) is entirely in the dark blue category, showing strong surveillance systems.
South American countries show variation, with some in the light blue category (e.g., Bolivia) and others in the dark blue (e.g., Brazil, Argentina).
Oceania
Australia and New Zealand are in the dark blue category, while smaller Pacific island nations fall into the light blue or medium blue ranges.
التحديات والاعتبارات
- Resource Limitations: Countries in the yellow and light blue categories often face significant resource constraints, limiting their ability to expand disease surveillance.
- Data Accuracy and Reporting: Surveillance levels may not always reflect actual efforts, as some countries may underreport or lack robust reporting mechanisms.
- Impact of Geopolitical Instability: In regions experiencing conflict, surveillance may be hindered, creating gaps in global animal health monitoring.
- Global Health Risks: Insufficient surveillance in some regions delays the detection and response to emerging diseases, posing risks to both animal and human health.
Recommendations for Strengthening Surveillance
- Capacity Building
Provide financial and technical support to countries with limited surveillance systems.
Implement training programs for veterinary and public health personnel to improve reporting and diagnostic skills.
- Regional Collaboration
Foster cross-border cooperation in disease surveillance to share resources and information.
Establish regional reference laboratories to support countries with limited infrastructure.
- Policy and Advocacy
Advocate for increased investment in veterinary public health and surveillance programs.
Promote policies that prioritise animal health as part of One Health initiatives.
- Technology Integration
Utilise digital tools and software for real-time data collection and sharing.
Implement automated systems for faster and more accurate disease detection.
الاستنتاج
The global map and pie chart highlight significant disparities in disease surveillance systems worldwide. While many countries have comprehensive systems in place, others face substantial challenges. Addressing these disparities through capacity building, regional collaboration, and technology integration is essential for improving global animal and public health outcomes